

Georgia Governor Statewide Findings
Key Findings
Methodology
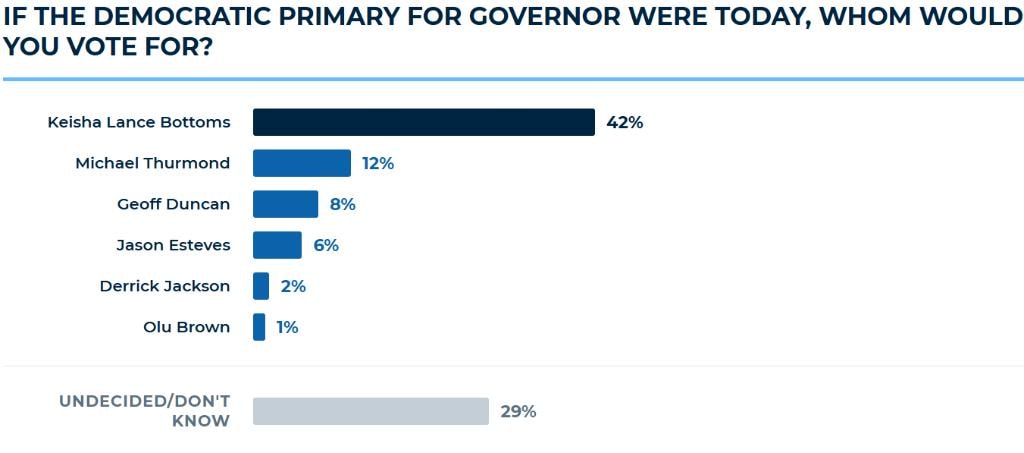
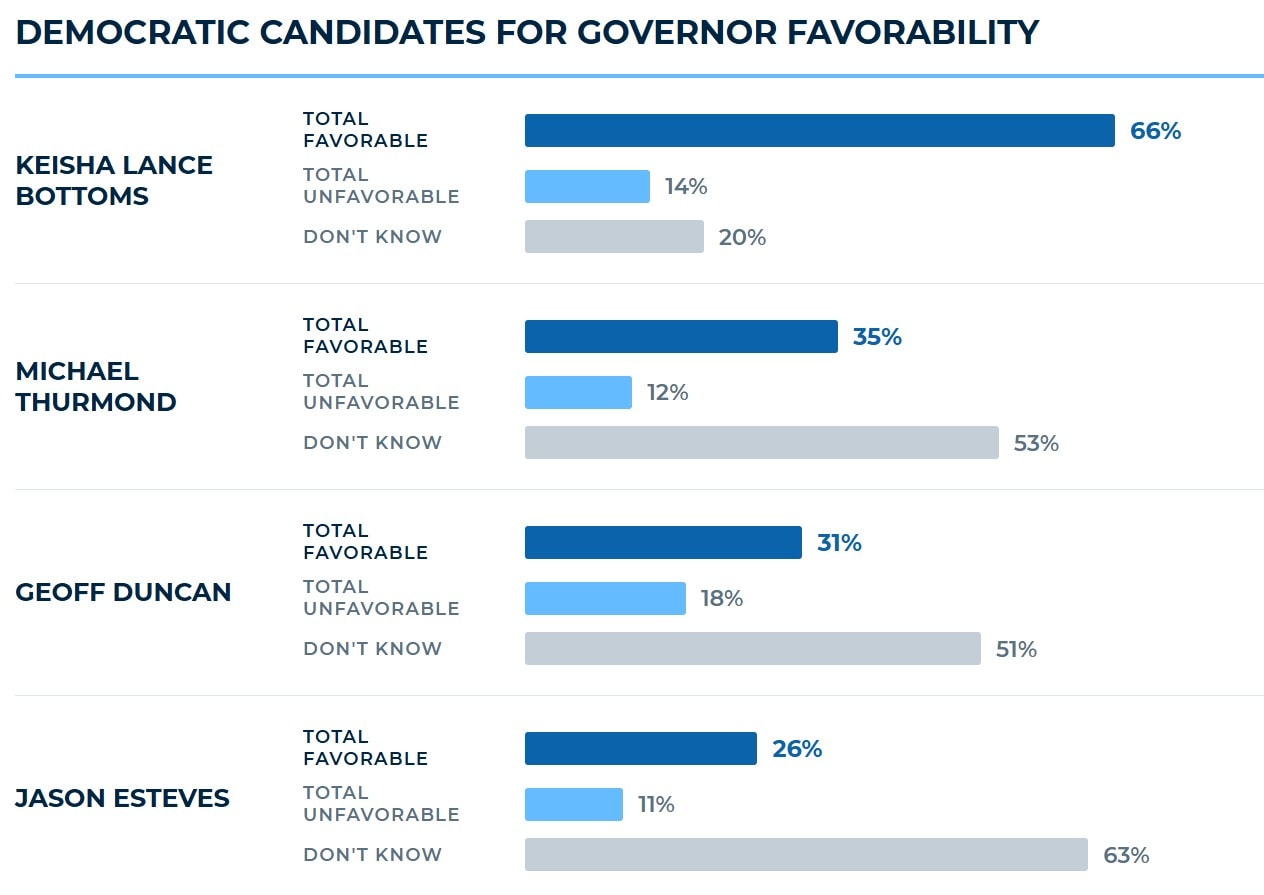
This survey was conducted between 03/31-04/10 with a sample size of 437 respondents. Data was collected by contacting likely Democratic Primary voters. This survey was conducted via live calls to cell phones and landlines and Text-to-Web surveys. The margin of error for this survey is +/- 4.68%. Data was weighted by the following: Race, Age, Gender, College Attainment, and Mode.

Rhode Island Governor Statewide Findings
Key Findings
Methodology
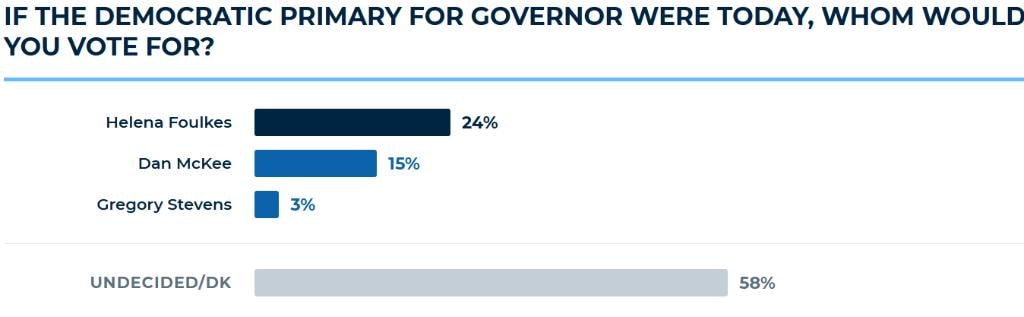
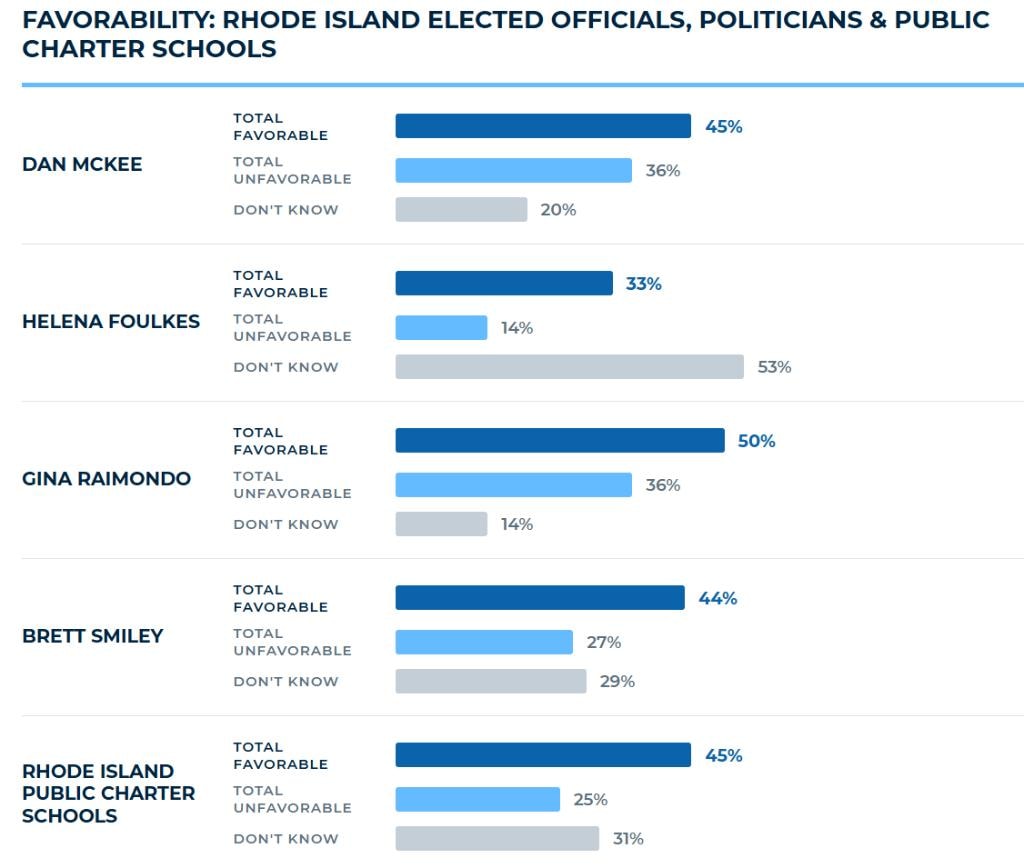
This survey was conducted on 02/28 with a sample size of 319 respondents. Data was collected by contacting likely 2026 Democratic Primary voters. This survey was conducted via live calls to cell phones and landlines and Text-to-Web surveys. The margin of error for this survey is +/- 5.44%. Data was weighted by the following: Race, Age, Gender, College Attainment and Congressional District.

New Jersey Governor Statewide Findings
Key Findings
Methodology
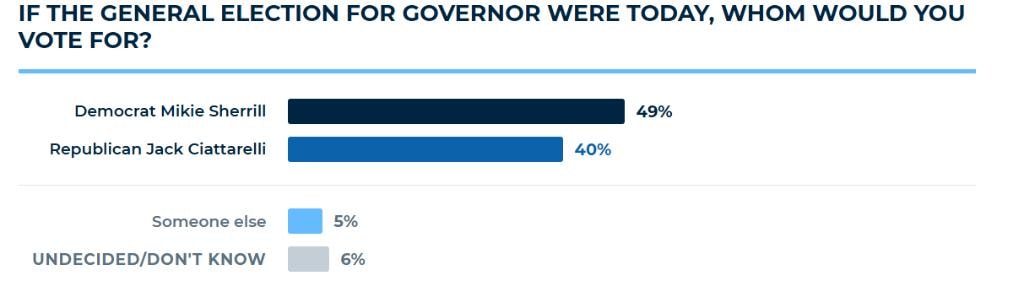
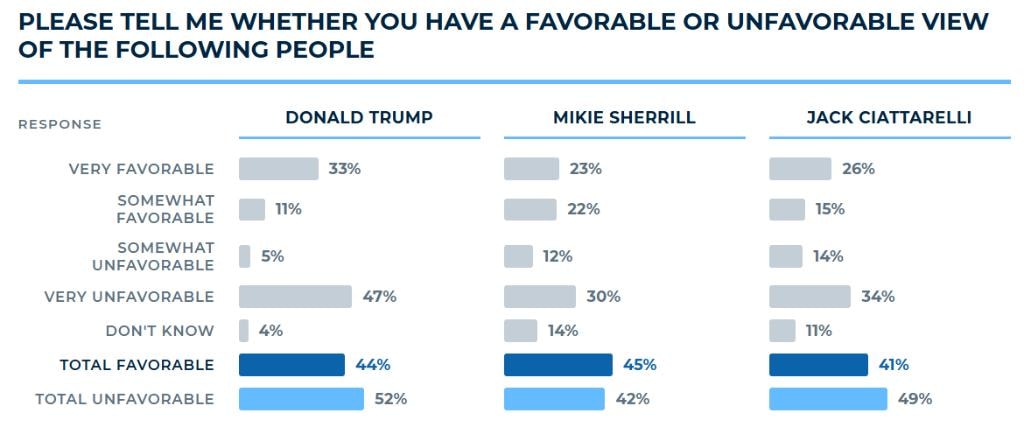
This survey was conducted between 10/16-18 with a sample size of 605 respondents. Data was collected by contacting likely voters for the November 2025 NJ Governor election via live calls to cell phones and landlines and Text-to-Web surveys. The margin of error for this survey is +/- 3.92%. Data was weighted by the following: Race, Age, Gender, Party, and College Attainment.

New Mexico Poll Findings
Key Findings
Methodology
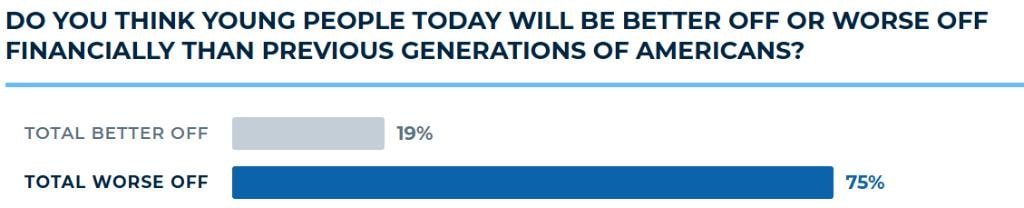
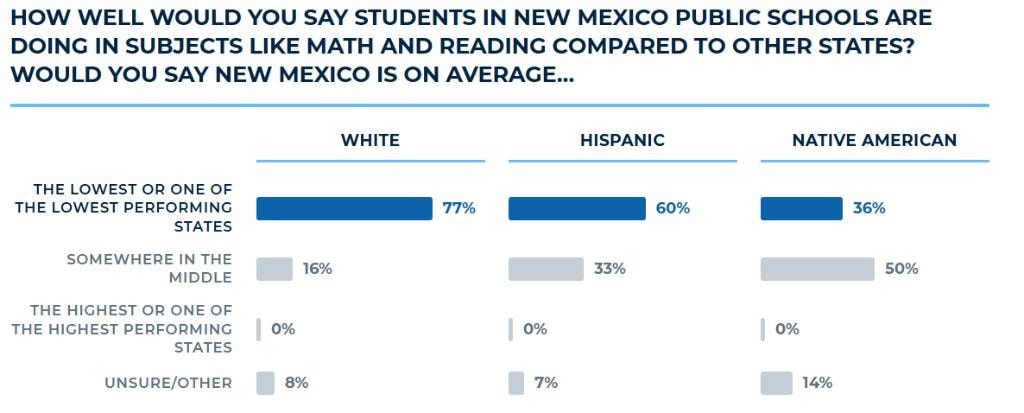
This Concord Public Opinion survey was conducted between 08/30-09/02 with a sample size of 600 respondents. Data was collected by contacting NM likely Democratic primary voters via live calls to cell phones and landlines and Text-to-Web surveys. The margin of error for this survey is +/- 3.94%. Data was weighted by the following: Race, Age, Gender.

Maryland Poll Findings
Key Findings
Methodology
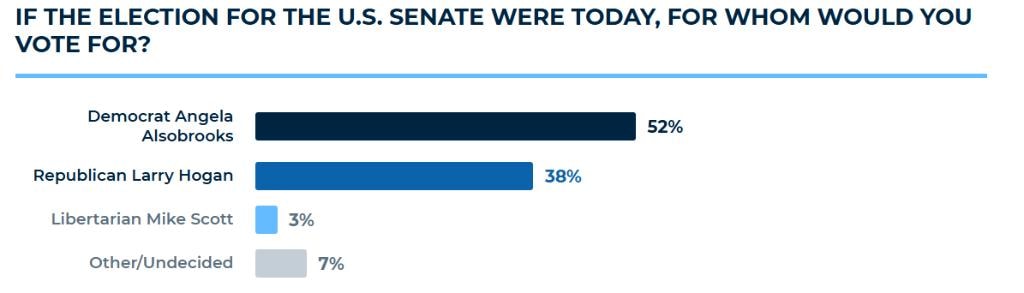
The Concord Public Opinion Partners poll was conducted November 1-3, 2024. The sample consisted of n=419 voters, with a credibility interval, similar to a poll's margin of error of +/- 4.74 percentage points. The data sets were weighted by gender, age, party, race, college attainment, and recalled 2020 presidential vote. Data was collected by contacting Maryland registered voters via live calls to cell phones and landlines and Text-to-Web surveys.
Maryland Democratic Primary Poll Findings
Key Findings
Methodology
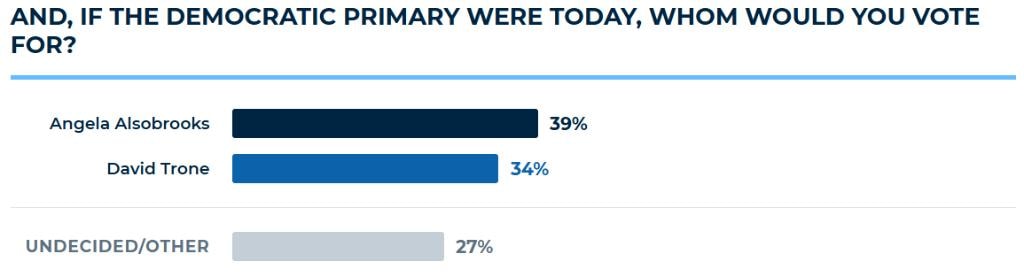
This Concord Public Opinion Partners poll was conducted between May 2nd-9th, 2024. The sample consisted of n=460 registered voters, with a credibility interval, similar to a poll's margin of error of +/- 4.52 percentage points. The data sets were weighted by gender, age, race and Congressional District. Data was collected by contacting voters selected from a Maryland registered voter file, via live calls to cell phones and landlines in addition to SMS text surveys.

Delaware Poll Findings
Key Findings
Methodology
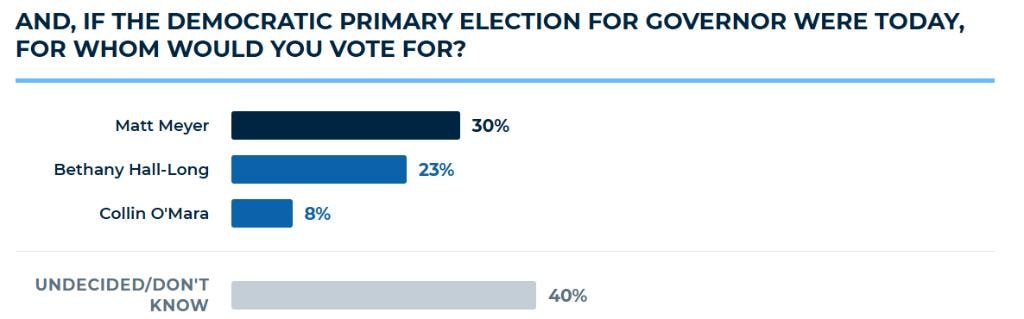
This survey was conducted between 8/2-4 with a sample size of 453 respondents. Data was collected by contacting registered Democrats via live calls to cell phones and landlines and Text-to-Web surveys. The margin of error for this survey is +/- 4.55%. The data sets were weighted by gender, age, race and education.

South Carolina CD 01 Poll Findings
Key Findings
Methodology
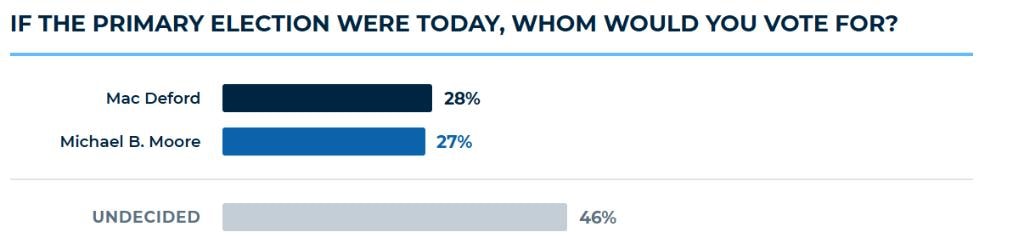
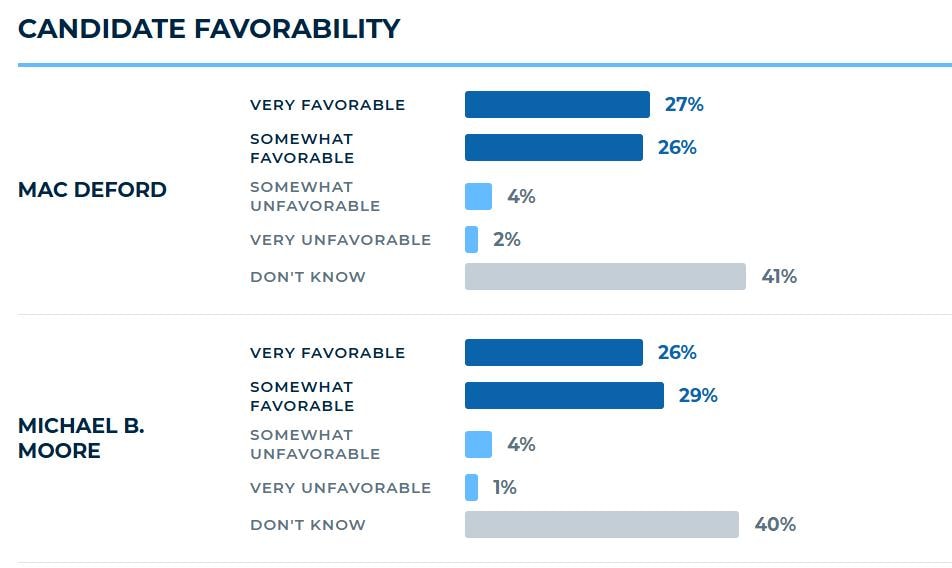
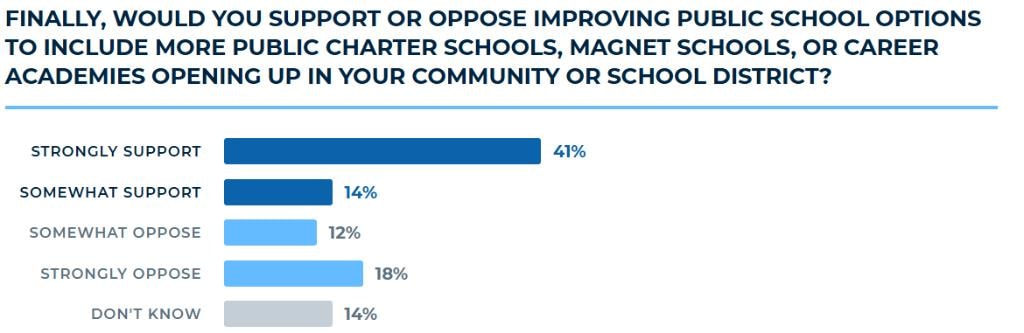
This survey was conducted between 5/23-26 with a sample size of 326 respondents. Data was collected by contacting SC 01 registered voters selected from the South Carolina voter file who had voted in recent Democratic primaries via live calls to cell phones and landlines. The margin of error for this survey is +/- 5.38%.

Kentucky Poll Findings
Key Findings
Methodology
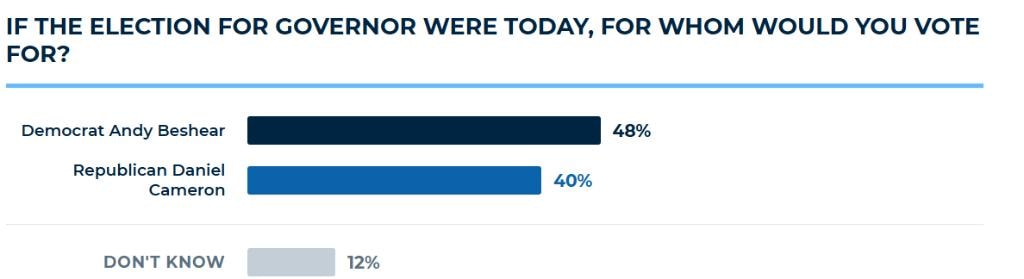
The Concord Public Opinion Partners poll was conducted November 1-2, 2023. The sample consisted of n=470 voters, with a credibility interval, similar to a poll's margin of error of +/-4.5 percentage points. The data sets were weighted by gender, age, party, race and education. Data was collected by contacting voters selected from the Kentucky voter file via live calls to cell phones and landlines.

Virginia CD 02 Poll Findings
Key Findings
Methodology
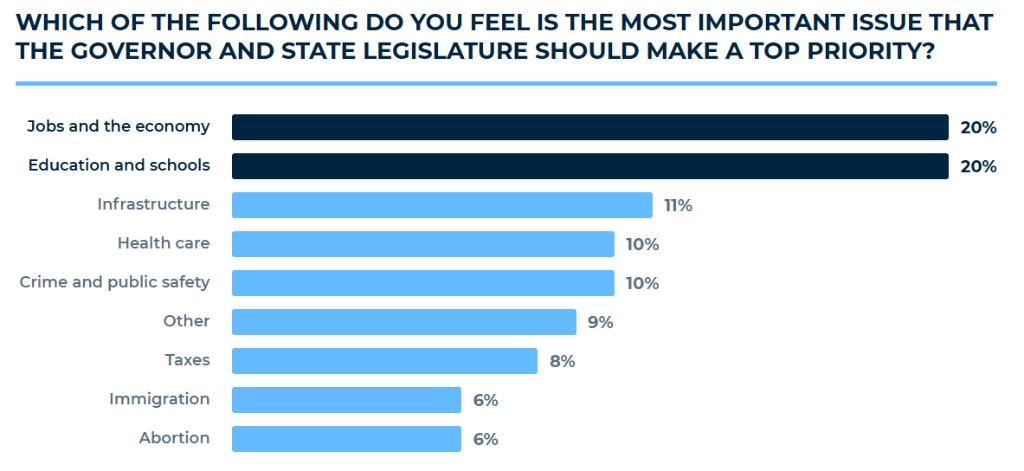
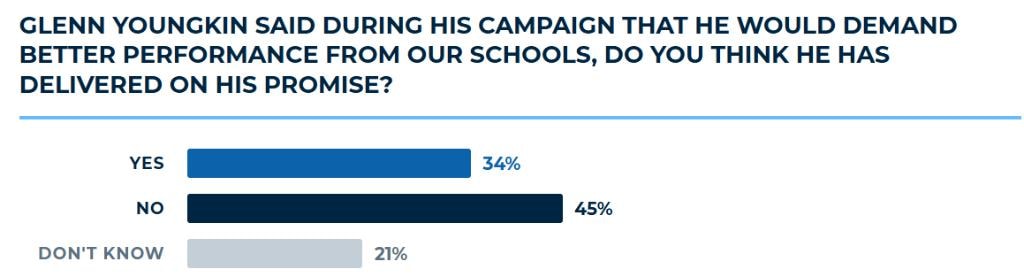
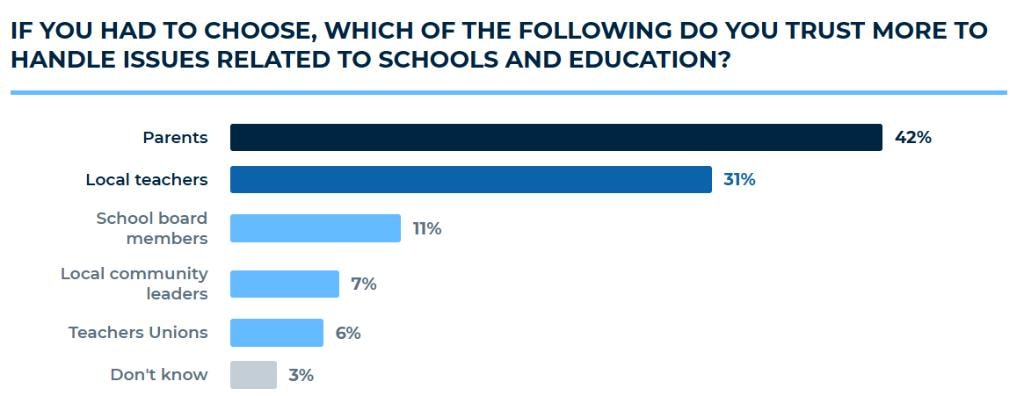
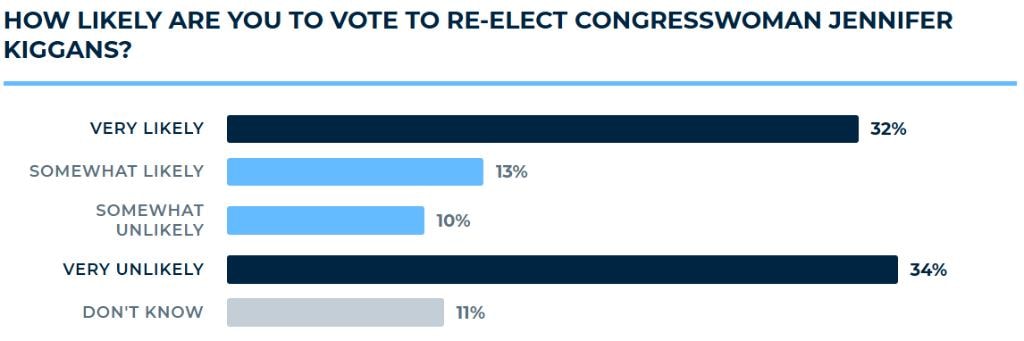
Concord Public Opinion sponsored by Education Reform Now Advocacy conducted a poll of n=200 likely voters who resided in Virginia's Second Congressional district. The survey was conducted in English and Spanish and collected via cellular and landline telephone calls from July 17th-19th, 2023. The margin of sampling error is +/- 6.9 percentage points.
Virginia CD 02 Poll Findings
Key Findings
Methodology
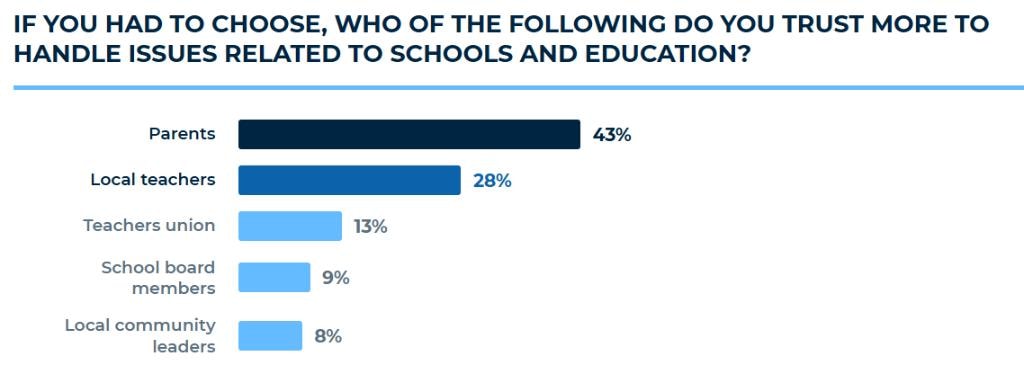
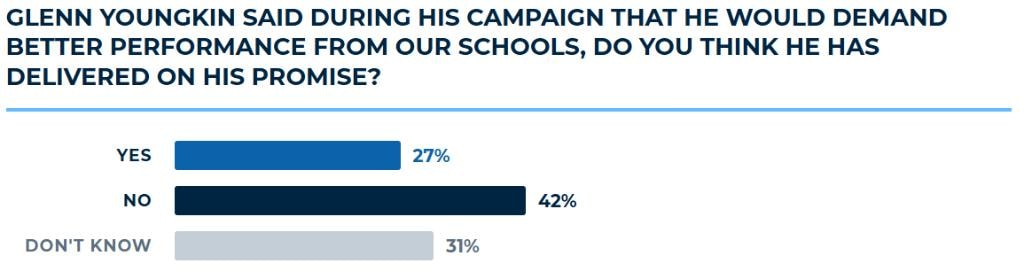
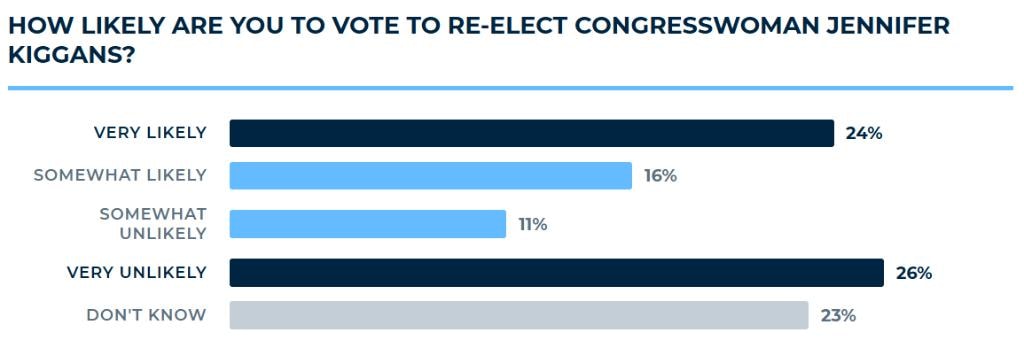
Concord Public Opinion sponsored by Education Reform Now Advocacy conducted a poll of n=455 likely voters who resided in Virginia's Second Congressional district. The survey was conducted in English and collected via cellular/landline telephone calls, or cellular text from October 7th-10th, 2023. The margin of sampling error is +/- 4.54 percentage points.

Memphis Mayoral Poll Findings
Key Findings
Methodology
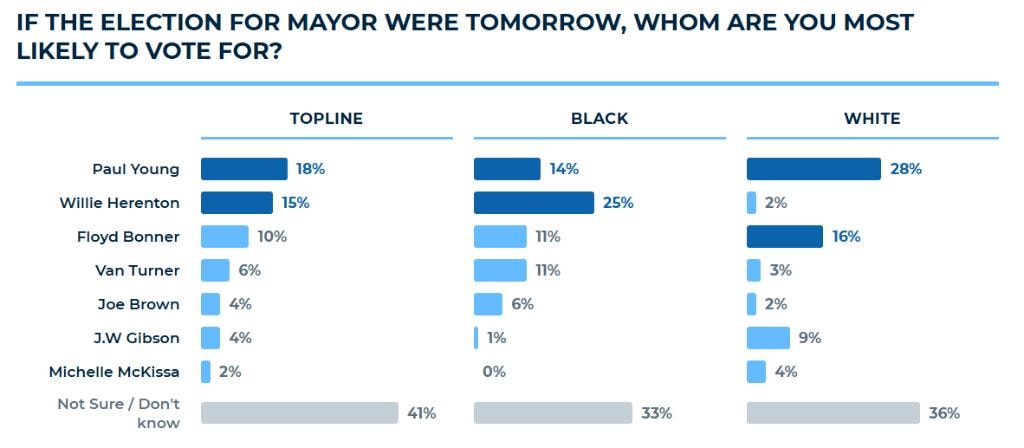
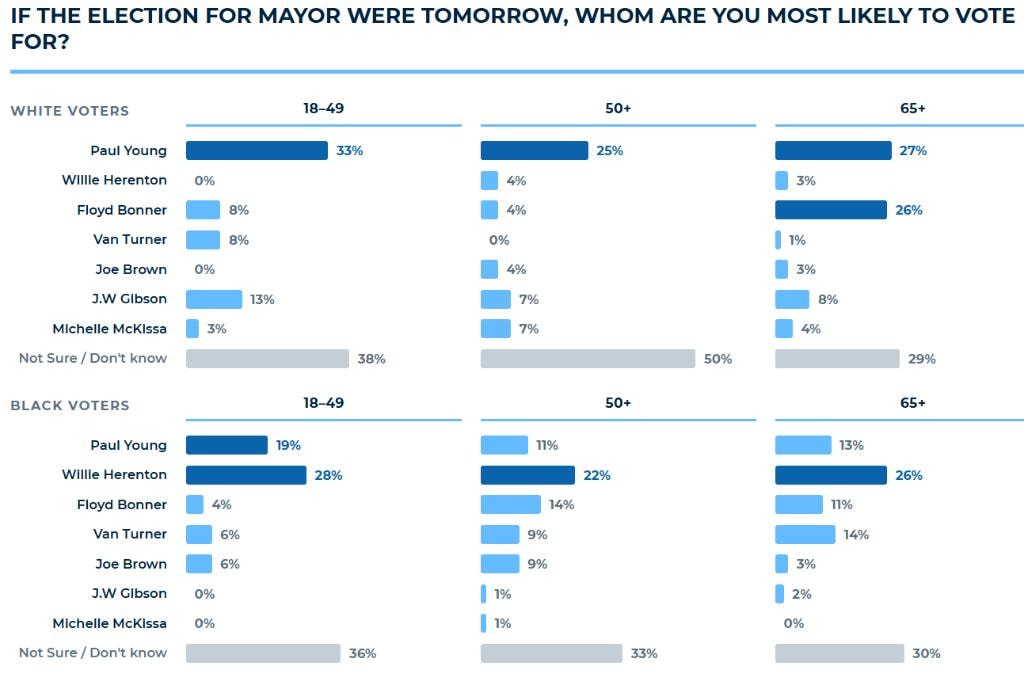
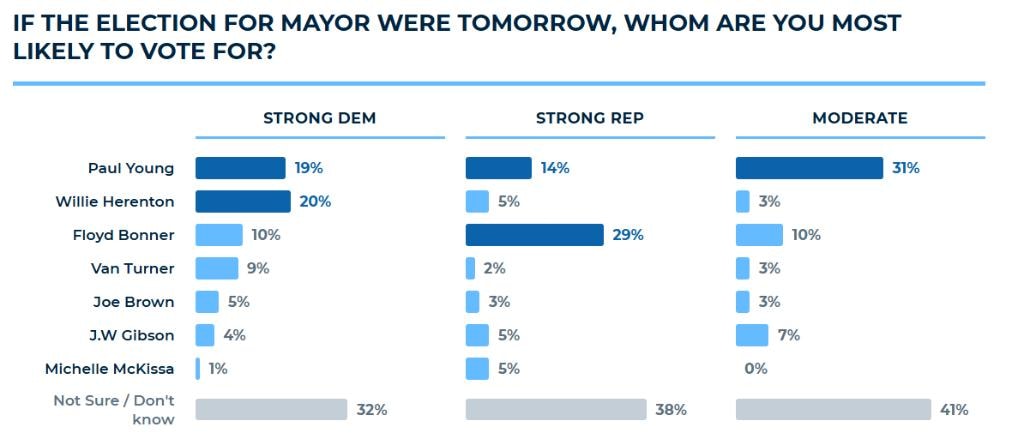
The citywide representative poll was conducted by Concord Public Opinion Partners Sept 10th, 2023, and surveyed likely municipal voters in Memphis TN. Data was collected by contacting cell phones and landlines via live callers. The sample size is n=376, with a MOE of +/- 5.89%.

Montgomery Poll Findings
Key Findings
Methodology
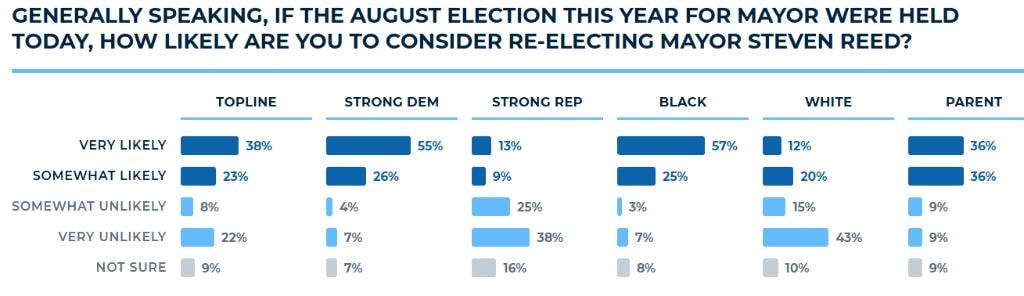
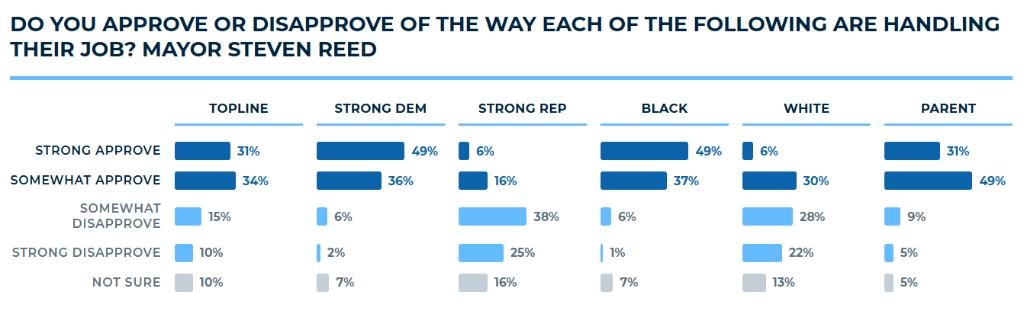
The citywide representative poll was conducted by Concord Public Opinion Partners May 10th, 2023, and surveyed municipal voters in Montgomery AL. Data was collected by contacting cell phones and landlines via live callers. The sample size is n=263, with a MOE of +/- 5.89%.